The 8% Model Framework
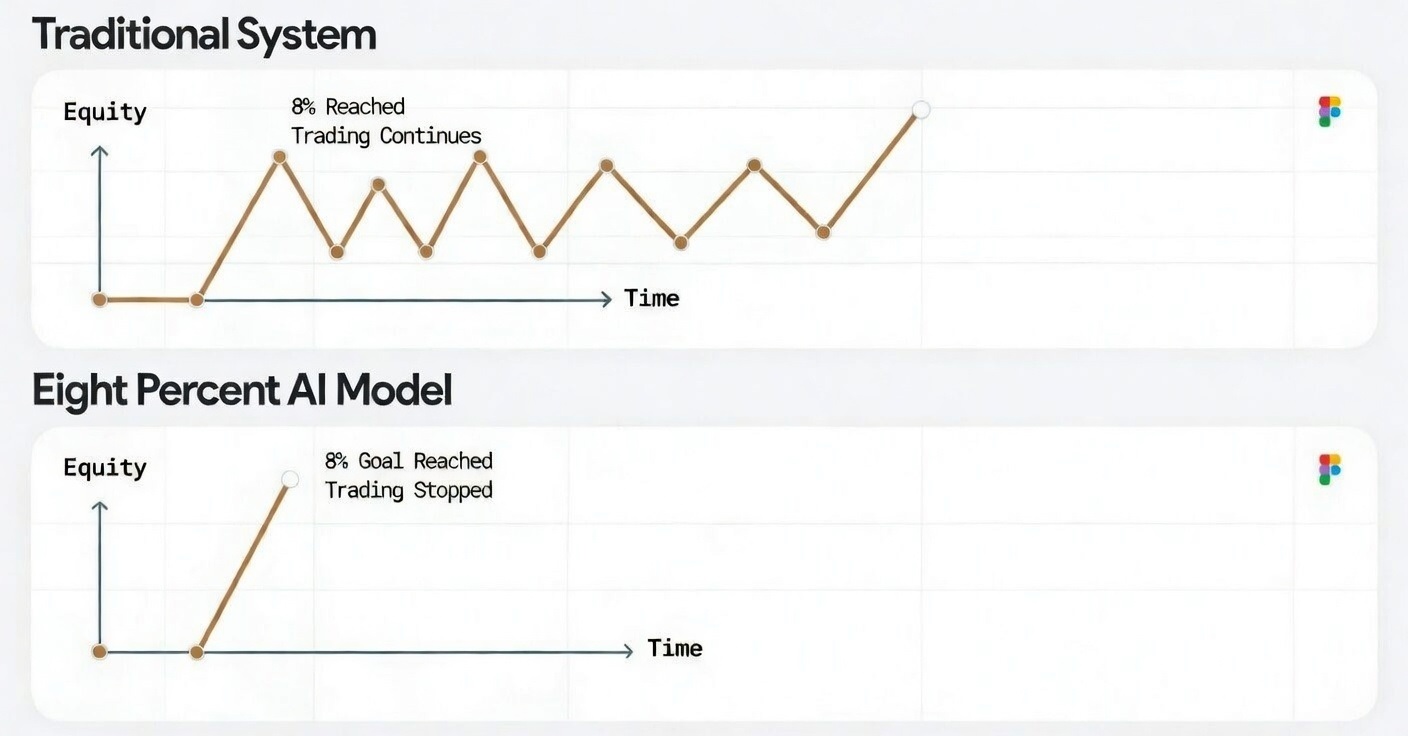
Traditional trading systems often continue operating after reaching a monthly objective. The EightPercent AI model is structured around a defined 8% monthly target in the managed master account, emphasizing consistency, disciplined execution, and capital preservation.
This approach utilizes a blended allocation of conservative and aggressive strategies, balancing drawdown control with performance to support consistent achievement of the monthly objective.
The framework is built on standardized $5,000 capital units.
Each $5,000 unit deploys two coordinated strategy components—one conservative and one aggressive— both operating on the same underlying capital base rather than requiring separate allocations.
Each component independently targets an 8% monthly return on the shared $5,000 capital unit. This structure is designed for capital efficiency, allowing both strategies to operate simultaneously while maintaining a single capital base.
In practice, the strategies often exhibit offsetting performance characteristics, where gains in one component may partially offset drawdowns in the other. This helps reduce performance volatility while maintaining consistent market exposure.
Importantly, the model is not structured on additive return assumptions (i.e., 16%), but instead targets a consistent 8% monthly objective per capital unit through coordinated multi-strategy deployment.
This structure reflects a capital-efficient overlay approach commonly used in institutional multi-strategy trading environments.
This approach allows the system to maximize capital utilization while maintaining a disciplined, risk-managed framework aligned with institutional trading models.
This modular structure enables linear scaling with capital while maintaining consistent strategy exposure across all deployment sizes.
The structure can be visualized as follows:
Two coordinated strategies operate on a single capital unit to achieve a consistent 8% monthly objective.
Built-in Downside Protection
The Trade Seat participation model introduces a supplementary revenue layer designed to enhance system stability.
It provides incremental cash flow during drawdowns, helping offset performance variability and improving overall drawdown efficiency.
Monthly Goal Track Record
Normalized to a $50,000 deployment example, the table below shows the combined monthly performance of the Conservative and Aggressive components against the $8,000 monthly objective. Results reflect the first point the monthly goal was achieved, or the month-end result if it was not reached.
| Month | Combined Result | % of $8,000 Goal | Status |
|---|---|---|---|
| June 2025 | $8,875.00 Normalized Breakdown Conservative$4,750.00 Aggressive$4,125.00 | 110.9% | Goal Reached |
| July 2025 | $10,125.00 Normalized Breakdown Conservative$4,375.00 Aggressive$5,750.00 | 126.6% | Goal Reached |
| August 2025 | $9,500.00 Normalized Breakdown Conservative$4,375.00 Aggressive$5,125.00 | 118.8% | Goal Reached |
| September 2025 | $7,125.00 Normalized Breakdown Conservative$1,875.00 Aggressive$5,250.00 | 89.1% | Not Reached |
| October 2025 | $9,500.00 Normalized Breakdown Conservative$4,375.00 Aggressive$5,125.00 | 118.8% | Goal Reached |
| November 2025 | $12,125.00 Normalized Breakdown Conservative$5,750.00 Aggressive$6,375.00 | 151.6% | Goal Reached |
| December 2025 | $9,250.00 Normalized Breakdown Conservative$4,250.00 Aggressive$5,000.00 | 115.6% | Goal Reached |
| January 2026 | $9,250.00 Normalized Breakdown Conservative$4,375.00 Aggressive$4,875.00 | 115.6% | Goal Reached |
| February 2026 | $10,000.00 Normalized Breakdown Conservative$4,750.00 Aggressive$5,250.00 | 125.0% | Goal Reached |
| March 2026 | $9,625.00 Normalized Breakdown Conservative$4,375.00 Aggressive$5,250.00 | 120.3% | Goal Reached |
| April 2026 | $3,000.00 Normalized Breakdown Conservative-$1,500.00 Aggressive$4,500.00 | 37.5% | Not Reached |
| May 2026 | $12,500.00 Normalized Breakdown Conservative$4,500.00 Aggressive$8,000.00 | 156.2% | Goal Reached |
| June 2026 | $11,625.00 Normalized Breakdown Conservative$4,625.00 Aggressive$7,000.00 | 145.3% | Goal Reached |
Live Client Account Results
Drawn from real client brokerage accounts that voluntarily shared statements. Figures reflect the average monthly return across real accounts, applied to a $50,000 deployment example to represent two accounts — one Conservative, one Aggressive — sharing a single license. Not separated by strategy, since clients trade the signals as they choose.
| Month | Average Result | % of $8,000 Goal | Status |
|---|---|---|---|
| November 2025 | $13,070.00 | 163.4% | Goal Reached |
| December 2025 | $8,840.00 | 110.5% | Goal Reached |
| January 2026 | $13,800.00 | 172.5% | Goal Reached |
| February 2026 | $13,190.00 | 164.9% | Goal Reached |
| March 2026 | $10,640.00 | 133.0% | Goal Reached |
| April 2026 | $10,390.00 | 129.9% | Goal Reached |
| May 2026 | $9,970.00 | 124.6% | Goal Reached |
| June 2026 | $11,625.00 | 145.3% | Goal Reached |